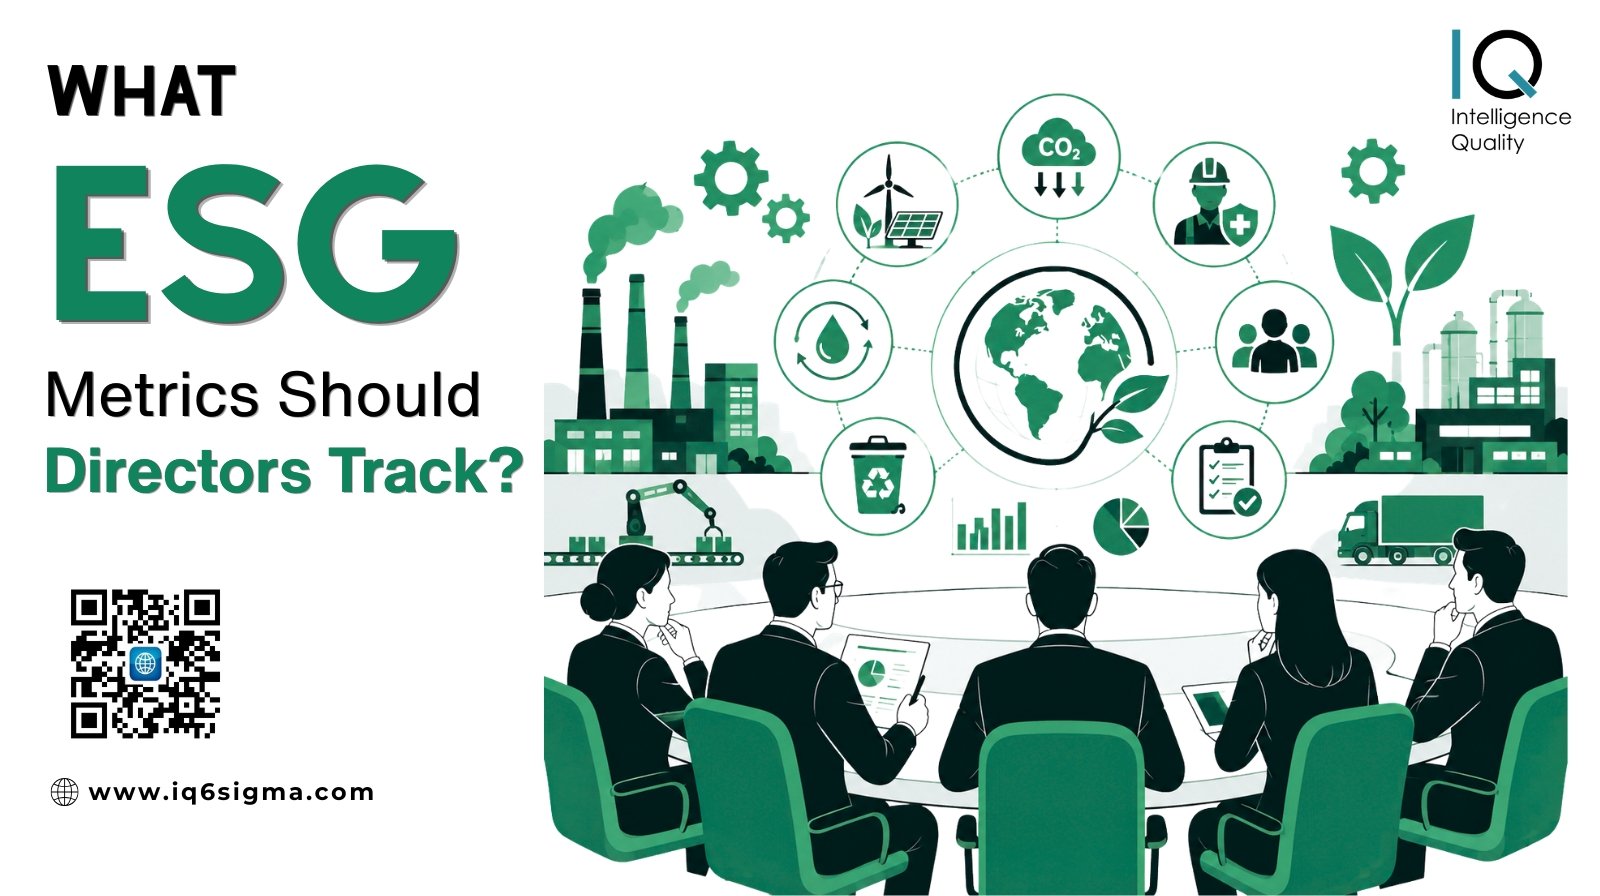
Environmental, Social, and Governance (ESG) considerations have evolved from a sustainability function to a board-level responsibility.
Investors, regulators, customers, employees, and lenders increasingly expect boards to oversee not only financial performance but also the environmental and social impacts that influence long-term value creation.
For directors, the challenge is not the lack of ESG data - it is identifying which metrics truly matter. Tracking too many indicators can dilute focus, while monitoring too few can expose organisations to significant risks.
Effective boards concentrate on a balanced set of material ESG metrics aligned with strategy, stakeholder expectations, and industry-specific risks.
Why ESG Metrics Matter at the Board Level
Directors have a fiduciary responsibility to oversee risks and opportunities that may affect long-term business performance.
ESG metrics help boards:
- Identify emerging risks
- Monitor regulatory compliance
- Strengthen corporate governance
- Improve stakeholder trust
- Support strategic decision-making
- Enhance resilience and competitiveness
Boards should focus on metrics that are material, measurable, comparable, and linked to business outcomes. The objective is not to create another reporting exercise but to integrate ESG into enterprise performance management.
Environmental Metrics
Environmental indicators help directors understand the organisation's exposure to climate risks, resource constraints, and regulatory changes.
Key metrics include:
Greenhouse Gas Emissions
Track:
- Scope 1 emissions
- Scope 2 emissions
- Material Scope 3 emissions
- Total emissions intensity per unit of revenue or production
- Progress toward net-zero targets
Directors should understand emission hotspots and review decarbonisation plans regularly.
Energy Management
Monitor:
- Total energy consumption
- Percentage of renewable energy used
- Energy intensity trends
- Energy cost savings from efficiency initiatives
Water Management
Track:
- Total water withdrawal
- Water consumption intensity
- Water recycling and reuse rates
- Operations located in water-stressed regions
Water security is becoming a critical business risk across many industries.
Waste and Circularity
Monitor:
- Total waste generated
- Hazardous waste volumes
- Waste diverted from landfill
- Recycling rates
- Material recovery rates
Climate Risk
Review:
- Climate-related financial impacts
- Physical climate risks
- Transition risks
- Climate adaptation investments
Social Metrics
Social indicators provide insights into workforce health, human capital development, supply chain responsibility, and stakeholder relationships.
Employee Health and Safety
Track:
- Total recordable incident rate (TRIR)
- Lost-time injury frequency rate (LTIFR)
- Fatalities
- Near-miss reporting rates
- Occupational health trends
Safety metrics are especially critical in manufacturing, construction, energy, and infrastructure sectors.
Workforce Engagement
Monitor:
- Employee engagement scores
- Voluntary turnover rates
- Retention of critical talent
- Employee absenteeism
- Internal promotion rates
Diversity, Equity, and Inclusion
Track:
- Gender diversity across leadership levels
- Workforce diversity metrics
- Pay equity indicators
- Representation in senior management
- Inclusion survey results
Learning and Development
Monitor:
- Average training hours per employee
- Upskilling and reskilling investments
- Leadership development participation
- Critical skill gap assessments
Human Rights and Supply Chain Responsibility
Track:
- Supplier ESG assessments completed
- Human rights incidents
- Supplier audit findings
- Corrective action closure rates
- Responsible sourcing compliance
Customer Metrics
Monitor:
- Customer satisfaction scores
- Net promoter score (NPS)
- Product quality incidents
- Data privacy breaches
- Product recalls
Governance Metrics
Governance indicators help directors assess whether the organisation has effective oversight, accountability, and ethical business practices.
Board Composition and Effectiveness
Track:
- Board independence
- Diversity of the board
- Director attendance rates
- Average board tenure
- Skills matrix coverage
Boards should periodically evaluate whether director competencies align with emerging ESG risks.
Ethics and Compliance
Monitor:
- Code of conduct violations
- Whistleblower complaints
- Corruption incidents
- Regulatory fines and penalties
- Compliance training completion rates
Cybersecurity and Data Privacy
Track:
- Number of cybersecurity incidents
- Data breaches
- Average incident response time
- Cybersecurity training participation
- Third-party cyber risk assessments
ESG Governance
Monitor:
- ESG targets linked to executive compensation
- Progress against ESG commitments
- External assurance of ESG data
- Materiality assessment updates
Risk Management
Track:
- Enterprise risk assessments completed
- Emerging ESG risks identified
- Business continuity preparedness
- Supply chain disruption indicators
Focus on Materiality
Not every ESG metric is relevant to every organisation.
Directors should focus on the issues that are most material to their business model, industry, geography, and stakeholders.
For example:
- Manufacturing companies may prioritise emissions, energy, safety, and waste.
- Financial institutions may focus on financed emissions, governance, and responsible lending.
- Technology companies may emphasise data privacy, cybersecurity, and talent management.
- Consumer goods companies may prioritise supply chain transparency and product sustainability.
A materiality assessment helps boards determine which metrics deserve the greatest attention.
Building an Effective ESG Dashboard
An effective board ESG dashboard should be:
- Concise and focused
- Linked to business strategy
- Forward-looking
- Benchmarkable
- Data-driven
- Easy to interpret
Rather than tracking dozens of indicators, many organisations focus on a core set of 10 to 15 key metrics. Boards should review ESG performance with the same rigour applied to financial metrics.
Questions Directors Should Ask
To strengthen oversight, directors should regularly ask:
- Which ESG issues are most material to our business?
- How do ESG risks affect long-term strategy?
- Are our targets measurable and time-bound?
- How reliable is our ESG data?
- How do we compare with peers?
- Are executive incentives aligned with ESG objectives?
- How prepared are we for future regulatory requirements?
The quality of board oversight often depends on the quality of these questions.
The Road Ahead
ESG is no longer a separate agenda item - it is becoming integral to business strategy, risk management, and value creation. Directors who monitor the right ESG metrics can better anticipate risks, identify opportunities, and guide their organisations toward sustainable growth.
The most effective boards recognise that ESG performance and financial performance are increasingly interconnected. In the years ahead, organisations will not be judged solely by what they earn, but also by how responsibly they create value.
For directors, the priority is clear:
Track the metrics that matter, ask the right questions, and ensure ESG remains embedded in strategic decision-making.