Power BI is a business analytics service and data visualization tool It allows users to connect to various data sources, transform and clean the data, create interactive reports, and share them with others.
Power BI is part of the Microsoft Power Platform, which includes other products like Power Apps and Power Automate.
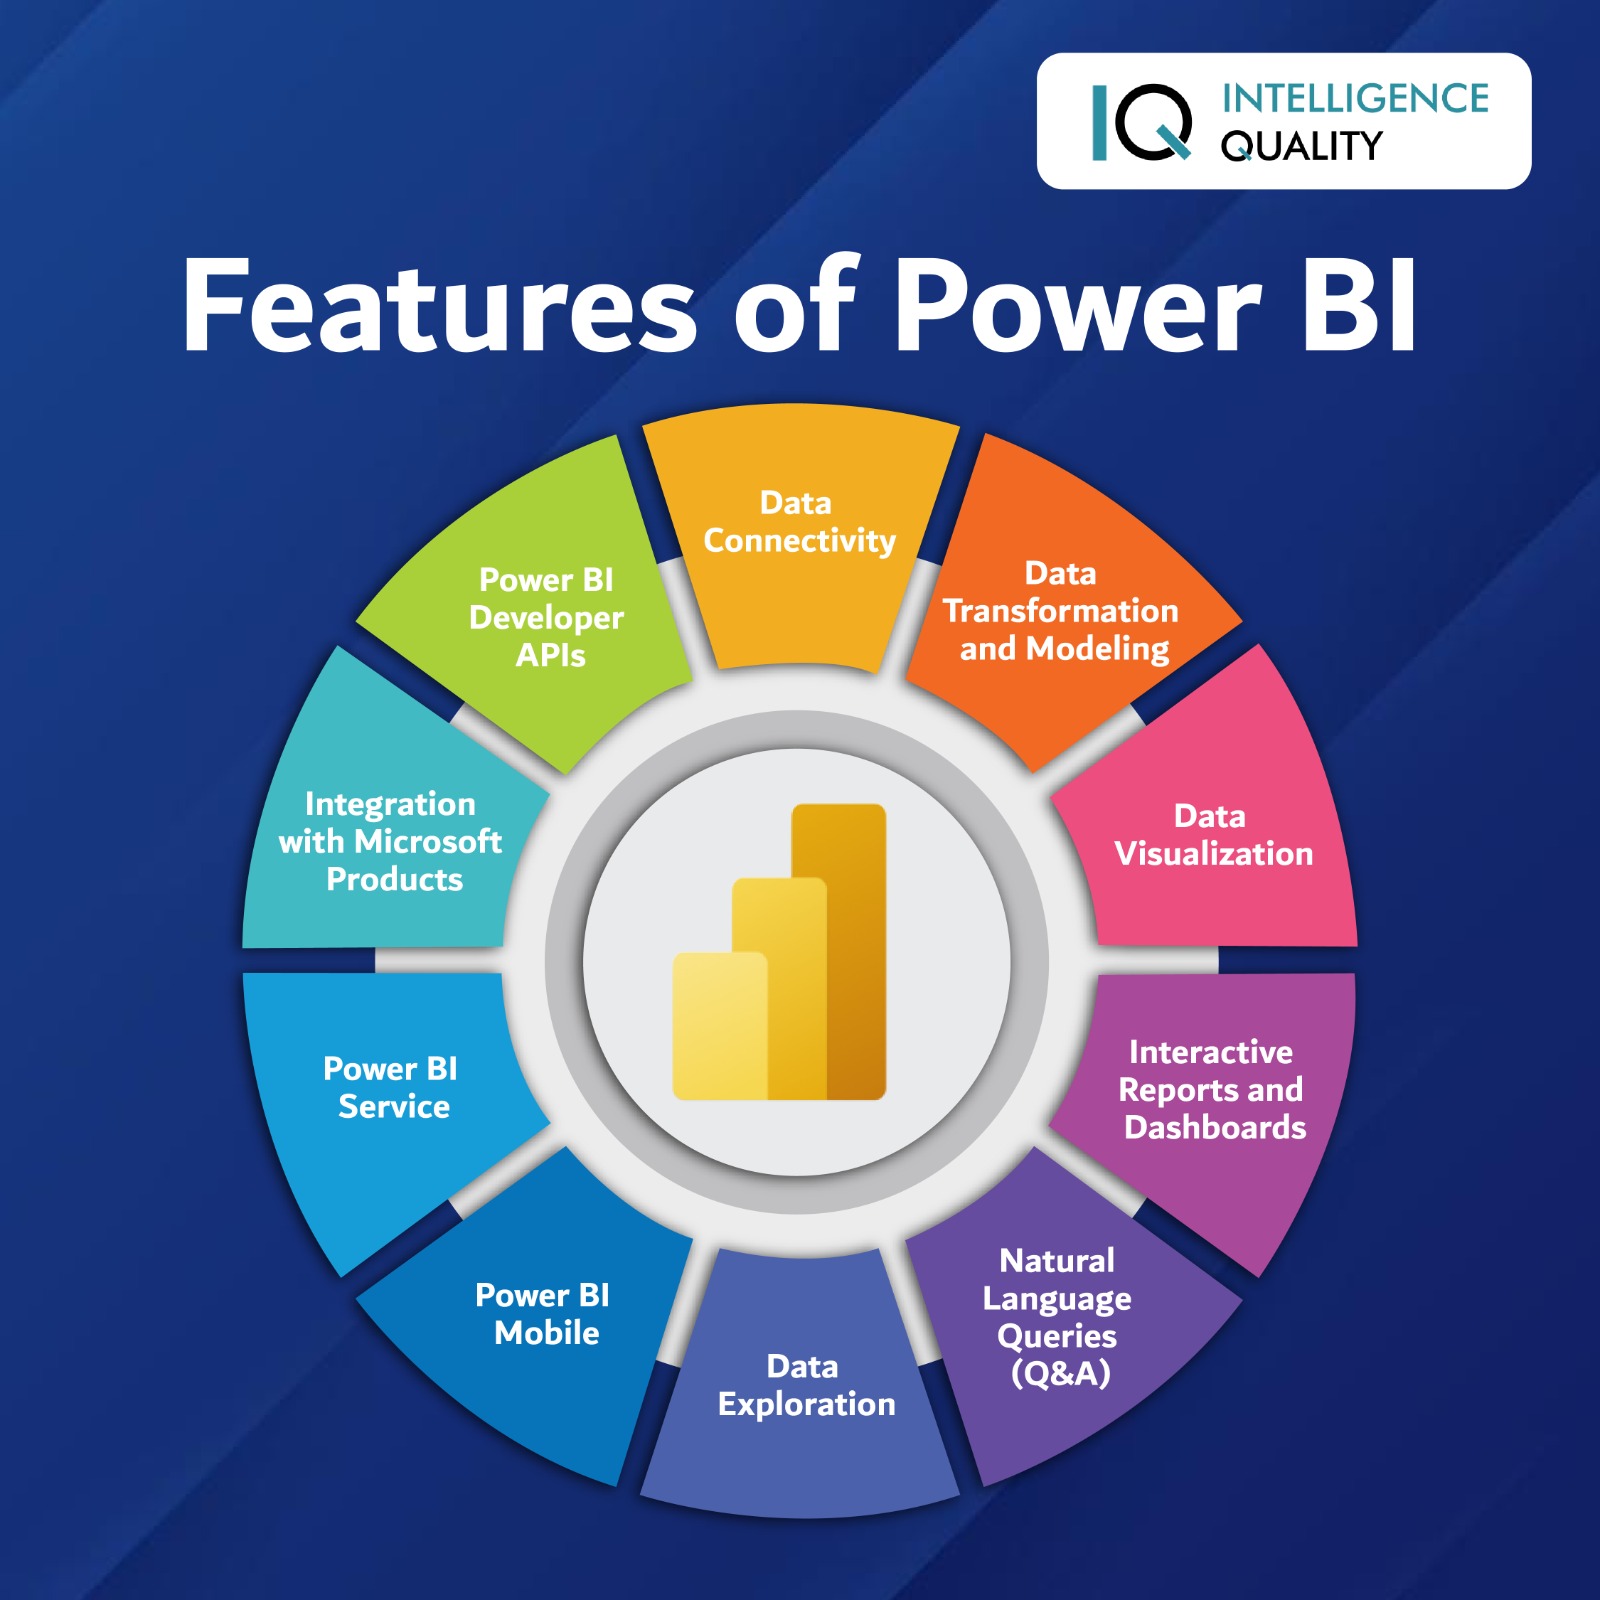
Key features and components of Power BI include:
Data Connectivity: Power BI can connect to a wide range of data sources, such as Excel spreadsheets, databases, cloud-based services (e.g., Azure SQL Database, SharePoint), and web services.
Data Transformation and Modeling:
Users can perform data transformation and modeling operations using Power Query Editor, which helps clean and shape the data to suit their analytical needs.
Data Visualization:
Power BI offers a vast selection of visualization options, including charts, graphs, maps, tables, and custom visualizations created by the Power BI community.
Interactive Reports and Dashboards:
Users can create interactive and dynamic reports and dashboards by dragging and dropping visualizations onto the canvas, allowing them to explore and analyze data interactively.
Data Exploration:
Power BI provides tools like drill-down, drill-up, cross-filtering, and slicers, enabling users to explore data from various perspectives easily.
Data Sharing and Collaboration: Reports and dashboards created in Power BI can be shared with others within the organization or externally. Users can collaborate and work on the same data models and visualizations simultaneously.
Power BI Mobile:
There is a mobile app for Power BI, available on various platforms, allowing users to access and interact with their reports and dashboards on the go.
Standardization is achieved on collecting accurate data, analysing every data and processes and providing timely solutions.
Besides the above mentioned points, LSS can also help the organisation in achieving Financial and Strategic benefits, empowerment of employees, program implementation, time management and reduced cycle time.
To conclude, deploying Lean Six Sigma methodology have only advantages and can take your company goals to the next level.
Obtaining a Power BI certification can significantly enhance your career growth and open up new opportunities in the field of data analysis, business intelligence, and data visualization developed by Microsoft Power BI. It offers numerous benefits for businesses and individuals looking to analyze, visualize, and gain insights from their data. Some of the key benefits of Power BI include: Data Visualization: Power BI allows users to create interactive and visually appealing dashboards, reports, and charts, making it easier to understand complex data sets and spot patterns or trends quickly.
Real-time Data Insights: With its ability to connect to real-time data sources, Power BI enables users to make data-driven decisions based on up-to-date information.
Industry Recognition:
A Power BI certification from a reputable organization or vendor (e.g., Microsoft) adds credibility to your skills and knowledge. It demonstrates to employers and peers that you have a validated proficiency in using the Power BI tool effectively.
Increased Earning Potential:
Certified professionals may command higher salaries compared to their non-certified counterparts. Employers recognize the value of certified individuals and are often willing to compensate them accordingly.
Skill Validation:
The certification process involves demonstrating your skills through exams and practical assessments. This validation ensures employers that you have a certain level of expertise in using Power BI, which can boost their confidence in your abilities.
Thus RPA is widely used in companies when compared to cognitive intelligence.
Networking Opportunities:
Many certification programs offer access to exclusive forums, groups, or events where you can connect with other certified professionals. Networking within these communities can lead to job opportunities and collaborations.
Career Flexibility
Personal Growth
Competitive Advantage
Career Advancement
Importance of Power BI
Power BI enables data visualization with interactive dashboards and charts.
It connects to various data sources, consolidating data into a coherent view.
Real-time updates and interactive reporting allow for quick data exploration.
Cloud-based collaboration and secure sharing of reports and dashboards.
Mobile apps provide access to data and insights on the go.
Self-service BI empowers non-technical users to create reports independently.
Cost-effective options with various pricing plans available.
Empowers informed decision-making with actionable insights.
Overall, a Power BI certification can be a key differentiator in your career journey, providing you with the knowledge, recognition, and opportunities for growth and advancement in the field of data analytics and business intelligence.